What’s your market DNA ?

With Australia Day still top of mind, it's timely to think about which version of Australia is your target?
Because there is more than one, and there are many benefits for content, promotions, marketing, ratings and revenue to really find out, and not just assume, the DNA of your own market.
The good news is there's an easy, free, online tool to do this!
 It's called QuickStats, available on the ABS website, using the latest 2011 Census data – click here
All you do is either enter the name of an area in QuickStats Search, or use Advanced Search to click on a map, and view a detailed profile of a wide range of info.
You could start with People, and explore topics like 5 year age cells, marital status, education, ethnicity, employment and how your listeners travel to work.
Then the Family and Dwellings sections go further into household incomes, rents&mortgages, types of housing, number of vehicles and so on. An obvious resource for sales, as well as insights for targeting content and promotions.
A powerful feature of QuickStats is a comparison with your State and the National average, showing what the results really mean. Is your market well above or below the average on a particular topic? Much easier to read than just a set of numbers in isolation.
"3 Bs" Case Study
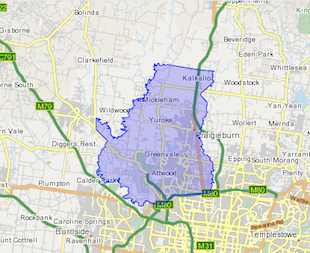
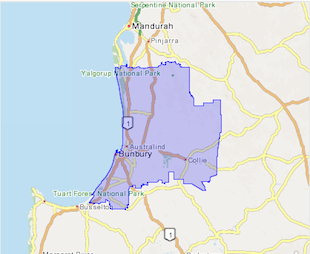
As a demo of how it works, here's a comparison of three locations (two metro, one regional) starting with B:
Bankstown (pop 159,072), Broadmeadows/Tullamarine (132,559), Bunbury (94,386).
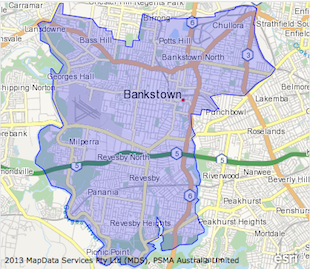
QuickStats has many options for defining an area. In this instance I've used the Statistical Area 3 definition, but it's very easy to select an option, and view on the map if it fits what you need.
 |
 |
 |
You can either look at your complete service area, or break it down into smaller segments: especially useful in the larger markets, because there are usually great differences between sub-regions.
If you don't fully understand the diversity, you're not in the game. And of course a further challenge for networked content across sharply differing versions of Australia.
Where Are The Diaries?
Ratings diaries are most concentrated in areas of highest population density, and your vision of the market may not match the reality of where diaries are placed. Especially as station staff lifestyles tend to gravitate to the inner city, and be disconnected from the heartland. Our Bankstown and Broadmeadows examples will be high on the list for diaries.
Ethnic/Cultural Diversity – The Reality
For the exercise, and a hot topic, a look at country of birth, language and religion.
Country of Birth
The national average for being born in Australia is 69.8%, Bunbury above average, the other two areas well below.
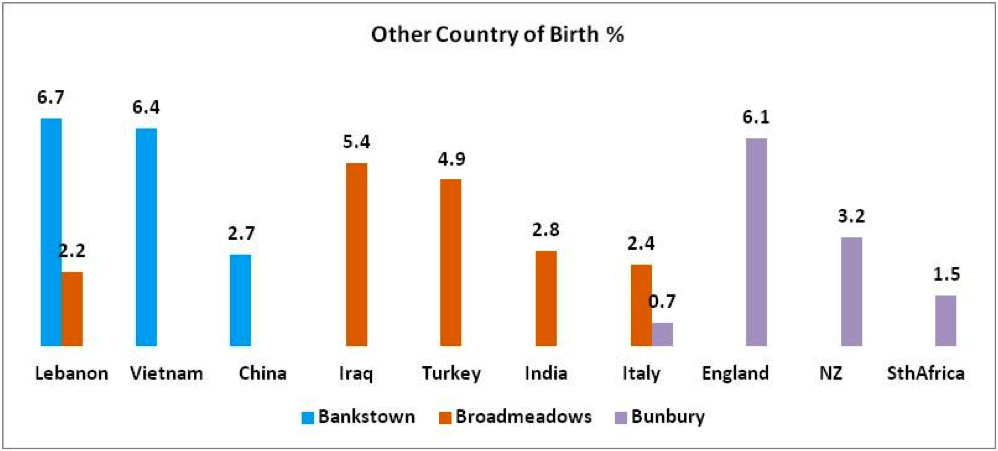
So if not born in Australia, where else? This graph highlights great differences between our markets.
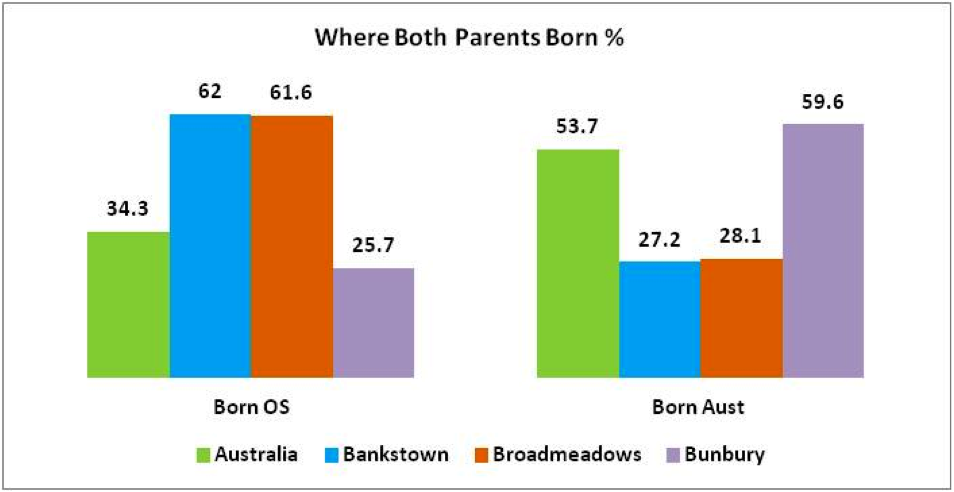
Digging further into Ancestry, because a person's family origins shapes their identity, here's where Both Parents were born. Note, there are much smaller percentages for one parent only from either OS or Australia. 34.3% of all Australians have both parents born OS, 62% in the metro areas, only 25.7% in Bunbury.
Languages At Home
While in Bunbury 88.4% of households are English-speaking only, in the other two areas over 50% speak more than one language.
The actual languages spoken breaks out into many smaller percentages, the most significant being the level of household Arabic in Bankstown, and Turkish in Broadmeadows.
Religion
Again, for an insight into influences, a snapshot of the larger faiths. Interesting how the more Australian-born Bunbury has above average No Religion, while the more OS-born Bankstown and Broadmeadows are more likely to have a religion. In particular Catholic and Islam.
The Takeaway
It's easy to build an accurate picture of your market DNA, using free information from ABS QuickStats – click here
In regionals, comparing your area with State&National averages will form a very useful profile, even if you think you already know your market inside out. You could be surprised at what the latest Census brings up, as every corner of Australian society is evolving all the time.
In metros I suggest you really need to get a handle on diversity between suburban groupings, and how that can affect everything from content to revenue.
This has nothing to do with "political correctness"! It is about taking chances and leveraging innovative creative opportunities from your market's unique mix and energy. Sourcing street language, talent and content from the real world of your heartland (diary-keeping) listeners.
Eriks Celmins is Managing Director of Third Wave Media, Adelaide-based consultant for media research, strategy and content.

