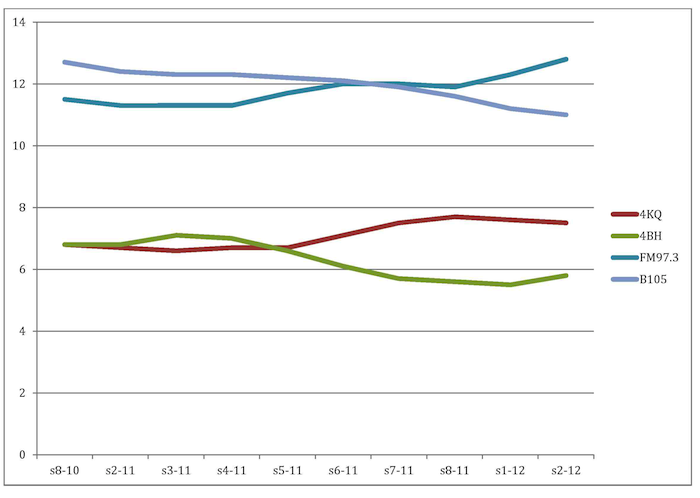
Brisbane Rolling Survey Trends

Each Survey day the headline numbers are analysed, commented on, distributed and all sorts of conclusions are drawn from them. A lot of those conclusions will be incorrect. Only in rare circumstances should any significant conclusions be drawn from any one survey result.
Radio Today has todays metropolitan survey results one click away, below.
| Sydney | Melbourne | Brisbane | Adelaide | Perth |
The only effective way to consider ratings of any station is to look at the trend-line – and specifically of the demographic you are are targeting.
However we obviously can’t trend every demographic in every market, each survey day we pick one market and look at the 10+ trend line across a 12-month period.
This trend-line is a 4-survey rolling average of the Brisbane market.
When you consider the long-term trends using a 4-survey rolling average, in Brisbane we see the following:
- 97.3 is clearly on a growth trend, even if the station declines in Survey 3, this trend-line will still be likely to remain positive.
- B105 is in significant decline, down nearly 2% on average in 12 months.
- 4KQ is growing. Irrespective of a small decline in todays survey result, the long-term trend shows the station is growing.
- 4BH is also in a signficant decline, down 1% on the rolling average across 12-months.
- For the rest of the stations, despite the ebbs and flows of individual surveys through the year, their rolling share figure today is essentially the same as it was 12 months ago…. ….Nova, Triple M, ABC612, Triple J and 4BC are all within 0.2% today on the rolling average, from where they were 12-months ago.
Interestingly in Brisbane we also see the following corelations.
- Whilst 4KQ is growing, and 4BH is declining – we also can see the relationship between those two stations. Further, we can see the relationship between B105 and 97.3.
- The trend-lines for these two pairings are mirrored – as shown below. As 4BH have declined, 4KQ have attracted those listeners. And as B105 has declined, those listeners have gravitated to 97.3.
It should be noted that whilst all radio stations look at the 10+ figures, the demographic performance are of more interest in measuring performance.
These graphs, as 10+, are meant only as a broad indicator as to the trend of the stations, rather than any deep, qualitative analysis.


