What's New
BY RadioToday Network August 31, 2024
What's New September 24, 2014
Who out performed who?
.png)
Bob Peters is a Director of Global Media Analysis Pty Ltd, a specialist financial and strategic consultancy to the media, entertainment, telecommunications and technology industries. His company has released detailed analysis on of five key metro players in the sector and their financial performance with the 2014 Annual Review of Metro Radio Financials.
It provides insights into how the Australian Radio Network (ARN); Fairfax Media (FXJ); Macquarie Radio Network (MRN); Pacific Star Network (PNW) and Southern Cross Austereo (SXL) have performed in the 2014 Financial year and who have been the standouts.
If you don't know your EBITDA from your EBIT, Bob explains it all and how each is going.
Introduction
Financial performance in the 2014 fiscal year was fairly benign for metropolitan commercial radio. Total revenues were virtually flat and operating profits and margins declined slightly. During the year, the FM sector outperformed the AM, while the stand-out corporate performers were ARN and Pacific Star Network.
These were the top line conclusions of the 2014 annual review of metropolitan commercial radio conducted by Global Media Analysis, which measures the financial performance of the five metro radio groups whose shares, or whose parent company shares, are listed on the Australian Securities Exchange (ASX).
The five companies included in the review were: the Australian Radio Network (ARN); Fairfax Media (FXJ); Macquarie Radio Network (MRN); Pacific Star Network (PNW) and Southern Cross Austereo (SXL).
Highlights
The highlights of GMA’s 2014 metro commercial radio’s annual review were:
- Total revenues were virtually static, declining by a fractional 0.2% to $578m; with a 1.6% increase in FM revenues being largely offset by a 4.1% decline in AM revenues;
- ARN was the top corporate sales performer with a 5.5% increase in total revenues and PNW was the only other metro group to record revenue growth (of 1.6%); while FXJ’s 6.1% decline represented the poorest revenue result;
- Metro operating expenses (opex) of $419m were limited to a marginal 0.9% increase during the year, with a 2.1% increase in FM costs more than offsetting a 1.2% decline in AM expenses;
- A modest 2.9% fall in aggregate metro radio operating profits to $159m, as measured by earnings before interest tax depreciation & amortisation (EBITDA), was the result of a 0.6% increase in FM sector profits being swamped by a sizeable 17.7% EBITDA reduction in the AM sector;
- PNW and ARN were the only broadcasters to increase operating profits during the year (by 16.8% & 9.8% respectively), while FXJ recorded the largest decline in EBITDA, with a 26.5% fall;
- EBITDA margins of 32.9% in the FM sector were more than double those of AM and ARN again had the industry’s highest margins; and
- Trends in metro earnings before interest and tax (EBIT) exhibited a similar pattern to EBITDA.
Total Revenues
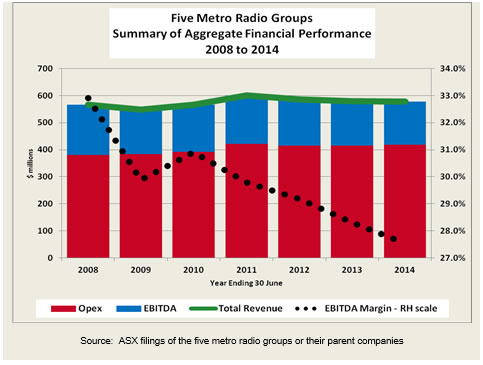
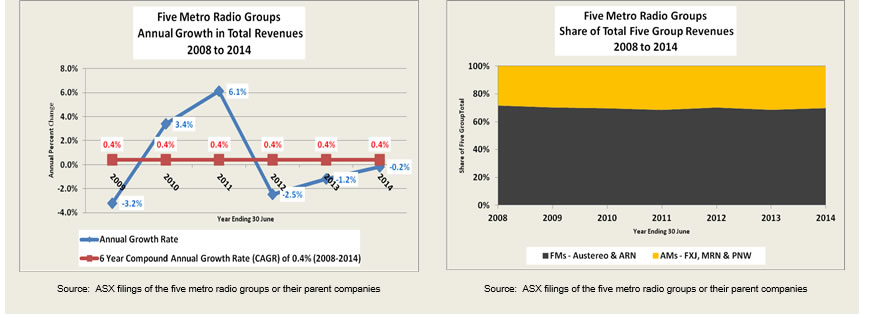
Total metro radio revenues were virtually static in fiscal 2014 (FY 2014), falling by a fractional 0.2% to $578m. It was the fourth year of decline in total revenues since FY 2008.
A modest 1.6% increase in FM revenues was offset by a larger 4.1% fall in AM revenues. Consequently, the FM sector increased its share of total metro revenues to 69.8%.
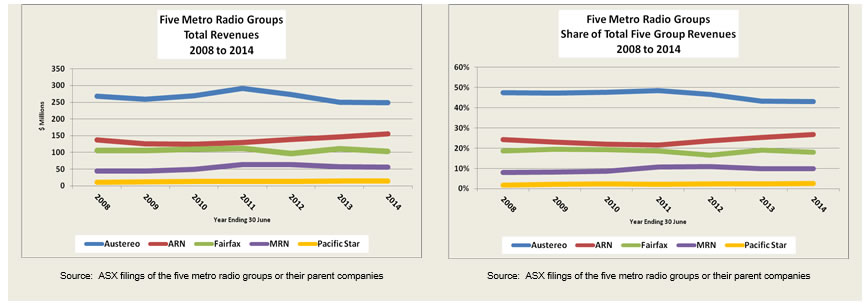
ARN was the top corporate revenue performer with a 5.5% increase and PNW was the only other metro group to record growth in total revenues (of 1.6%).
SXL and MRN each experienced small revenue reductions (of 0.6% and 1.7% respectively); while FXJ suffered a larger 6.1% decline.
Although SXL retained a commanding 43.0% share of total metro revenues in FY 2014, ARN continued to chip away at that dominance. Over the past three financial years, ARN’s share of total metro revenues has grown by 5.3%, while those of SXL have declined by 5.4%.
Operating Expenses
In fiscal 2014, each of the five commercial metropolitan radio groups under review again managed to keep a tight rein on operating costs before depreciation, amortisation, interest and tax (opex), resulting in a marginal aggregate increase of such expenses of only 0.9% for the metro sector, taking the total to $419m.
The AM stations actually reduced aggregate opex by 1.2%, almost matching their achievement of the preceding year; while the FM stations limited their combined costs to a modest 2.1% increase.
Earnings Before Interest, Tax, Depreciation & Amortisation (EBITDA)
For the third year in a row, aggregate metro EBITDA experienced a modest decline, albeit by only 2.9% in the most recent fiscal year to reach $159m. This was the product of a fractional 0.6% rise by the FM stations earnings, being offset by a sizeable 17.7% fall in aggregate AM operating profits.
The FM sector’s share of metro EBITDA consequently increased from 80.5% to 83.5%, while AM’s share slipped to only 16.5%.
PNW and ARN were the only broadcasters to increase operating profits during the year (by 16.8% & 9.8% respectively), while FXJ recorded the largest decline in EBITDA, with a 26.5% fall.
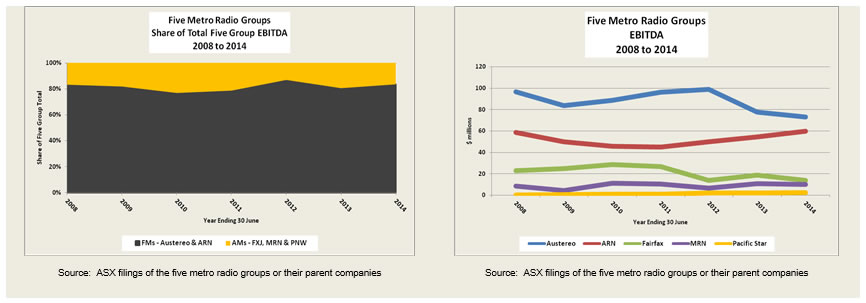
Despite a 5.8% decline in operating profits during the period, SXL retained a leading, but diminishing, 46.0% share of metro EBITDA in FY 2014.
However, on the back of impressive 9.8% growth in EBITDA last year, ARN continued to close the metro operating profit share gap, achieving an estimated 37.5% share, in the just concluded period.
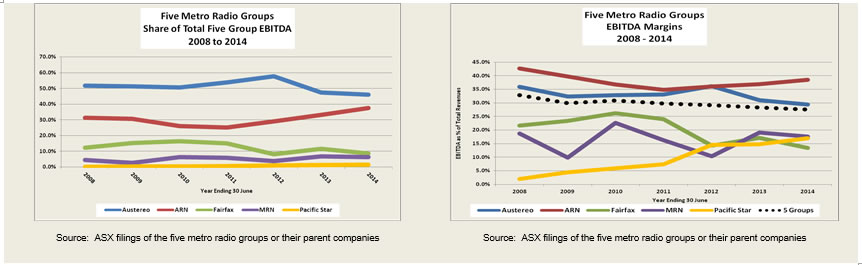
EBIDA Margins
Metro EBITDA profit margins fell for the fourth straight year to reach 27.5% in FY 2014. Margins for the AM sector declined the most and at 15.1%, they were less than half of the 32.9% recorded by the FM stations as a group.
PNW and ARN were the only metro groups to improve their profit margins. It was the sixth straight year in which PNW’s margins increased, while ARN continued to lead the industry with an estimated 38.5% EBITDA margin.
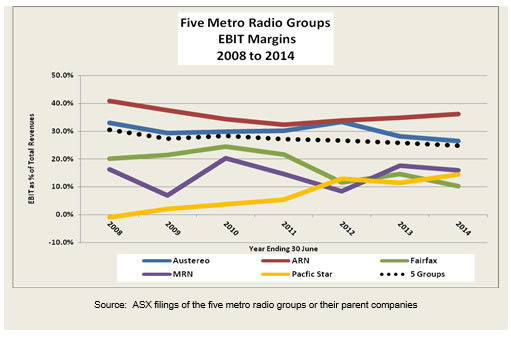
Earnings Before Interest and Tax (EBIT)
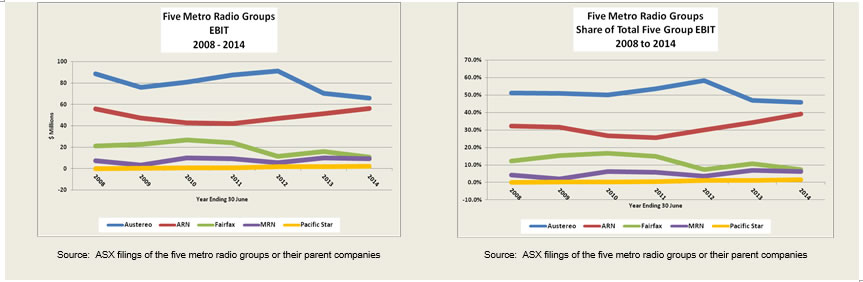
Trends in metro radio earnings before interest and tax (EBIT) exhibited a similar pattern to EBITDA. Total metro radio EBIT declined for the third year in a row to reach $144m, with a 3.8% fall being the product of a sizeable 29.3% reduction in AM sector earnings more than offsetting a fractional 0.3% rise in FM profits.
The FM sector accounted for an increased 84.8% share of total metro EBIT, while the AM stations aggregate profit share slipped to only 15.2%.
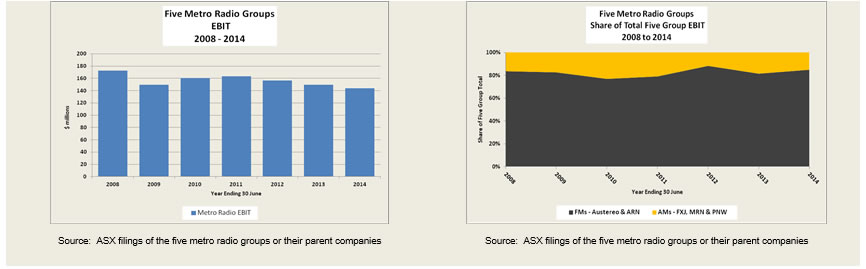
SXL retained the largest (45.8%), but declining, share of metro EBIT, while ARN continued to narrow the gap, by taking its profit share up to 39.1%.
PNW and ARN were the only metro radio groups to increase EBIT in the year, by 29.3% and 9.4% respectively, while FXJ suffered the largest profit reversal with a 33.5% reduction in EBIT.
EBIT Margins
Metro radio EBIT margins fell for the third consecutive year to a still impressive 24.9% level, with both the FM and AM sectors experienced some margin erosion.
However, FM’s 30.2% EBIT margins in FY 2014, again substantially exceeded AM’s relatively modest 12.5%.
As was the case with EBITDA, ARN continued to have the industry’s highest profit margins by recording a 36.2% EBIT margin last year.
For further information pertaining to this research report, contact Bob Peters of Global Media Analysis at: [email protected]
Disclaimer:
Disclaimer The information and opinions in this report were prepared by Global Media Analysis (GMA) on information which GMA believes to be reliable. However GMA makes no representations as to the accuracy or completeness of such information. No reliance should be placed on information contained in this report without prior consultation from GMA as to your specific requirements. GMA may have current or prior advisory relationships with some of the companies or individuals referred to in this report.
Any information provided is subject to change without notice to you although the information includes material as well as research commentary relating to media matters. GMA is not providing advice though this report and does not represent that any such advice or commentary is suitable to you.
You the reader agree to make your own independent evaluation of the merits and suitability for you of the commentary given which reflects the author’s analysis as of the date published. The accuracy, completeness and timeliness of such information cannot be guaranteed and is subject to change.
GMA, its affiliates, agents and directors shall not have any responsibility for direct, indirect, consequential, special or other damages you incur as a consequence of your reliance on information provided in this report and GMA, its affiliates, agents and directors hereby expressly disclaim all express and implied warranties, including without limitation, warranties of merchantability, fitness for a particular purpose and error-free and uninterrupted services. GMA does not warrant, guarantee or make any representation or warranty whatsoever express or implied or assume any liability to you regarding:
the use of the results of the use of the information provided including without limitation any financial results based on use of the information, or;
System performance and effects on or damages to software and hardware in connection with any use of any GMA site containing this report.
In addition to and without limiting the foregoing, GMA shall not be liable for any harm caused by the transmission, through any GMA Site, of a computer virus or other computer code or programming device that might be used to access, modify, delete, corrupt, deactivate, disable, disrupt or otherwise impede in any manner the operation of the services of any of your software, hardware, data or property.
Recent comments (0)
Post new comment
Related news
What's New
BY RadioToday Network August 30, 2024