Bob Peters
BY Staff Writer March 14, 2016
Bob Peters October 3, 2016
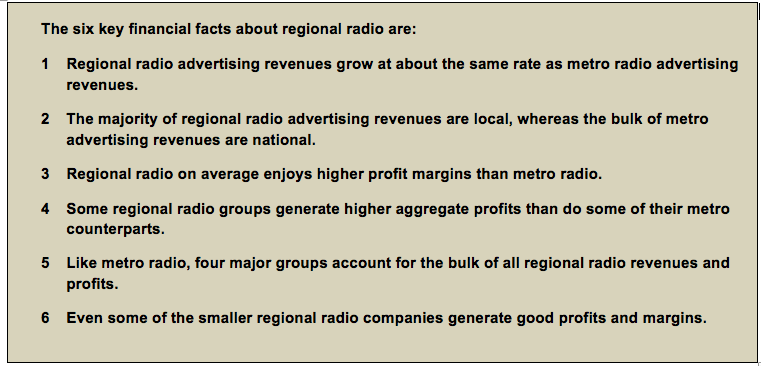
Six Key Financial Facts About Regional Radio

Although it is a strong and consistent performer, and although it accounts for about one-third of total radio revenues and almost 40% of all industry profits, much less is written about the financial characteristics of the regional radio sector relative to its metropolitan counterpart.
That being so, in the lead-up to the 2016 National Radio Conference, Global Media Analysis has sought to at least partially redress that imbalance by examining six key financial facts about regional radio, through the use of ten illustrative financial charts.
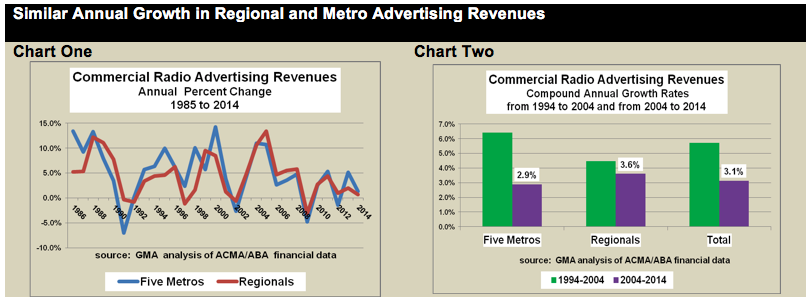
Fact One: Regional and Metro Radio Advertising Revenues Grow at Similar Rates
Regional and metropolitan radio advertising revenues typically grow at very similar rates.
Broadcasting financial data compiled and published by the Australian Communications and Media Authority (ACMA) show that over the 30 year period up until fiscal year (FY) 2014 there has been a very close correlation in annual growth rates of regional and metro radio advertising revenues, as shown in Chart One.
Moreover, over the most recent decade, regional advertising radio revenue growth actually outpaced metro growth, increasing at a compound annual growth rate of 3.6% compared with a lesser 2.9% rate for all stations in the five largest metro markets, as shown in Chart Two.
Unfortunately there is typically an 18 to 24 month delay in the publication of ACMA’s financial data, so there is always a lag in assessing the most recent revenue performance of the regional sector. However, it is not unreasonable to use the revenue performance of the sector’s largest commercial operator, Southern Cross Austereo (SCA), as a reasonably reliable proxy for the entire regional sector.
SCA’s regional radio advertising revenues increased by 3.5% in FY 2015 and 6.1% in FY2016 and those rates of increase were broadly in line with increases of 5.1% in FY2015 and 5.9% in FY2016, which Commercial Radio Australia reported for metro radio.
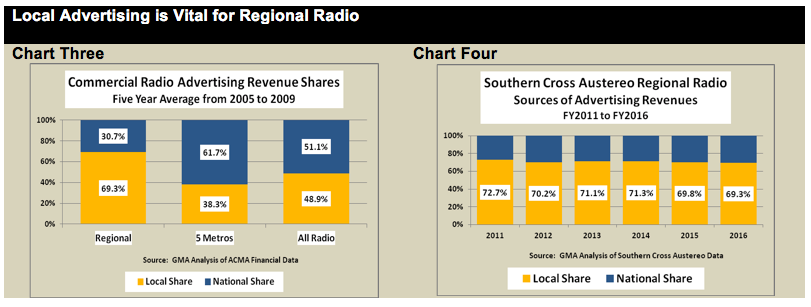
Fact Two: Regional Advertising Revenues are mostly Local
While the annual rates of growth in advertising revenues in the regional and metro radio sectors are generally very similar, the sources of those revenues are quite different.
ACMA financial data shows that historically local sources accounted for more than two-thirds of all regional radio advertising revenues, whereas they accounted for less than 40% of all metro radio ad revenues.
The sources of advertising revenues for the regional and metro sectors between FY2005 and FY2009, which was the last time period for which ACMA provided such a breakdown, are shown in Chart Three. Over that five year period, 69.3% of regional radio advertising revenues came from local sources, whereas such sources accounted for only 38.3% of all metro radio ad revenues.
In short, while local advertising revenues are the life blood of regional radio, metro radio is much more reliant on national advertising.
Although ACMA unfortunately stopped reporting the ad revenue split between local and national sources back in FY2009, it is possible to verify the continuation of that share split right up to the present day by again examining the recent performance of regional radio leader SCA. Between FY2011 and FY2016, local sources on average accounted for 70.7% of all advertising revenues generated by SCA’s regional radio operations, as can be seen from Chart Four.
Most recently, in FY2016, SCA reported that its regional radio operations generated $162 million in advertising revenues, of which 69% were from local sources while 31% were from national sources. In contrast, SCA also stated that of the $222 million in ad revenues recorded by its metropolitan radio operations in that same year only 29% came from local sources, with 71% coming from national/agency.
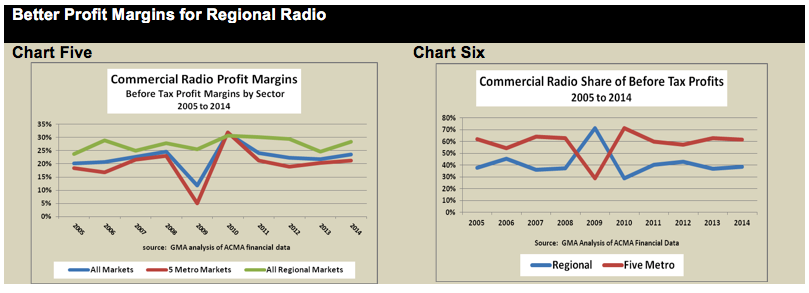
Fact Three: Regional Radio Generates Higher Profit Margins than Metro Radio
As strange as it may initially seem, most available evidence suggests that regional radio is a more profitable business than metro radio, at least when measured by profit margins.
ACMA financial data indicates that during the decade ending in FY2014, before tax profit margins for regional radio were significantly greater than those for metro radio in all but one year, as shown in Chart Five.
Consequently, for most of the 10 year period ending in FY2014, regional radio accounted for about 40% of commercial radio before tax profits, as shown on Chart Six, even though that sector attracted less than one third of total radio revenues over that same period.
Fact Four: Regional Radio Sometimes Generates Larger Profits than Metro Radio
Not only does regional radio as a whole generate higher profit margins than metro radio, but in some instances it also generates greater aggregate operating profits, as GMA believes was the case with Southern Cross Austereo’s regional and metro radio operations over the past two years.
GMA estimates that SCA’s regional radio operations generated EBITDA, before deducting corporate expenses, of about $65.9 million in FY2016, as shown in Chart Seven, which were significantly greater than the $51.4 million which was reported by SCA for its metro radio operations in that same year, as shown in Chart Eight.
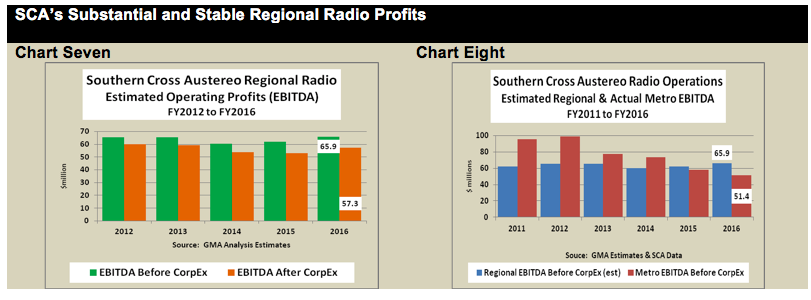
SCA’s estimated regional radio operating profits in FY2016 were also significantly greater than the EBITDA of $25.5 million reported for the same period by Macquarie Media Limited, the recently rebranded combination of the Macquarie Radio Network and the Fairfax Radio operations. Moreover, Macquarie Media’s operating profits are believed to have been not been that much greater than Grant Broadcasters’ yet-to-be reported EBITDA for FY2016.
Fact Five: Four Groups Generate Most Regional Radio Revenues and Profits
As is the case with metro radio, four groups generate the bulk of all regional radio revenues and profits.
However, while the three largest metro radio groups (ARN, Nova and SCA) are currently fairly equally sized in terms of ratings, revenues and profits, in the regional sector SCA is by far the dominant player, followed in diminishing order by Grant Broadcasters (Grant), Broadcast Operations and Ace Radio Broadcasters (Ace).
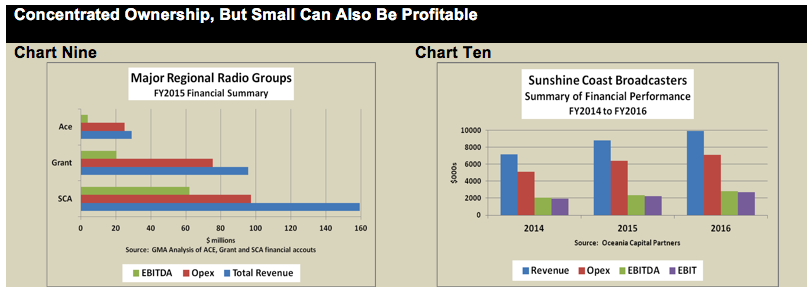
The financial performances in FY2015 of three of those four largest regional broadcasters are compared in Chart Nine. Unfortunately that chart excludes Broadcast Operations, whose financial performance GMA believes probably sits about midway between those of Grant and Ace.
Fact Six: Some Single Market Regional Owners Generate Very Good Profits and Margins
Although economies of scale usually help to improve profitability, good profits and margins are nevertheless available for some smaller single market regional broadcasters, especially those operating in the larger regional markets, such as Queensland’s single station owner Hot Tomato on the Gold Coast and duopoly owner Sunshine Coast Broadcasters on the Sunshine Coast.
For example, Chart Ten shows the impressive financial performance of Sunshine Coast Broadcasters over the past three years under the current ownership of Oceania Capital Partners and radio industry veteran Glenn Wheatley, through their EON Broadcasting corporate vehicle, which in FY2016 managed to achieve very attractive EBITDA and EBIT profit margins of 28.6% and 27.0% respectively.
Recent comments (0)
Post new comment
Related news
Bob Peters
BY Staff Writer October 1, 2015
Bob Peters
BY Staff Writer February 28, 2015
Bob Peters
BY Staff Writer February 24, 2014